Overview
- Position bias is a phenomenon commonly observed in recommender systems where items displayed at the top of a list (e.g., search results, recommendation list) are more likely to be clicked on or selected than items displayed lower down the list, even if the lower ranked items might be a better match for the user’s preferences.
- For example, a user is most likely to click the top link Google search recommends whether it is relevant or not. This bias occurs because users tend to pay more attention to items displayed at the top of the list and are more likely to interact with those items. This creates a negative loop in which unpopular items will be poorly recommended, therefore will receive much less visibility than popular ones, and will struggle to receive interactions. While it is expected that some items will be less popular than others, this issue specifically refers to the fact that the recommender has not enough collaborative information to recommend them in a meaningful and reliable way. As a result, the top-ranked items may receive a disproportionate amount of user feedback (whether the item was relevant or not), which can in turn reinforce their ranking, perpetuating the bias.
- The figure below (source) shows the number of user interactions associated to each item in the MovieLens dataset. Few items have a very high number of interactions, more than 5000, while most of the others have less than 100.

- Position bias can lead to suboptimal recommendations and lower overall system performance. Below we will look at different aspects of positional bias.
Reasons for position bias
- Position bias can happen for several reasons for example:
- Attention bias: Users tend to pay more attention to items that are shown in more prominent positions, as these are often the first items that they see. This can lead to a self-fulfilling cycle where popular items are shown in prominent positions, which in turn makes them even more popular.
- Trust bias: Users may assume that items shown in prominent positions are more trustworthy or of higher quality than items shown in less prominent positions, even if this is not actually the case.
- Default bias: Users may choose items in prominent positions simply because they are the default options, or because they are the easiest to access. This is particularly true for users who are in a rush or who are not familiar with the available options.
- Feedback bias: Recommender systems often use user feedback, such as ratings or clicks, to improve their recommendations. However, if the items shown in prominent positions receive more feedback, this can create a feedback loop that further reinforces position bias.
- Information overload: When users are presented with a large number of options, they may rely on heuristics such as position or popularity to quickly narrow down their choices. This can lead to a bias towards items in prominent positions, even if other options are more relevant or suitable.
- Unfortunately, because of positional bias, it is difficult to know whether the users engagement was because the item was relevant or because the item was ranked high.
- Additionally, in offline training when the model is trained on historical data, we are reinforcing this bias through the feedback loop.
Measuring positional bias
- Let’s look at a variety of ways to measure positional bias.
Examine user engagement by position
- This involves analyzing the click-through rate (CTR) or conversion rate of items at different positions in the recommendation list.
- One way to do this is to divide the recommendation list into multiple position groups (e.g., top 3, top 5, top 10) and calculate the average CTR or conversion rate for each group.
- Another way is to plot the CTR or conversion rate for each position and look for any noticeable trends or drop-offs.
Calculate position-based metrics
- There are several metrics that can be calculated based on the position of recommended items, such as discounted cumulative gain (DCG) and expected reciprocal rank (ERR).
- These metrics can be used to compare the performance of different recommendation algorithms or to evaluate the effectiveness of different position-based recommendation strategies.
- One way to calculate DCG is to sum the relevance scores of recommended items at each position, weighted by a discount factor based on the position. To calculate ERR, a probabilistic model is used to estimate the likelihood of a user clicking on an item at each position, with higher weights given to items that are clicked on earlier in the list.
Randomize item positions
- This involves randomizing the order of recommended items in the list and measuring the change in user engagement or performance metrics.
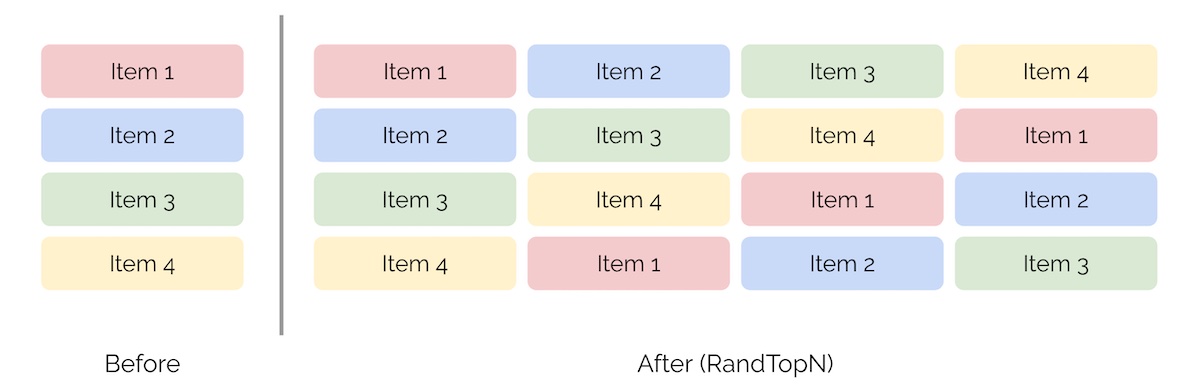
- One way to do this is to randomly shuffle the list for a subset of users or for a subset of recommendation requests (using RandN or RandTopN), and compare the results to a control group that receives the original ordered list.
- Another way is to generate multiple randomized lists and compare their performance to the original list.
- This is not a recommended approach as it results in terrible user experience and can be quite costly. We can see how it would look with the illustration below (source).
Control for item popularity
- This involves controlling for the popularity or quality of recommended items when analyzing user engagement or performance metrics.
- One way to do this is to group items by popularity or quality level and compare the performance of different recommendation algorithms or position-based strategies within each group.
- Another way is to use propensity score matching to create balanced groups of users who have similar preferences or behavior, and then compare the engagement or performance metrics for each group.
Use counterfactual evaluation
- This involves simulating the outcomes of different recommendation strategies or algorithms, and comparing their performance to a baseline or control group.
- One way to do this is to use a simulation model that estimates the likelihood of user engagement or conversion based on different recommendation features or strategies, and then compares the outcomes of the simulation to the actual user behavior.
- Another way is to use A/B testing or multi-armed bandit algorithms to test different recommendation strategies in a live environment, and measure the difference in engagement or performance metrics between the different groups.
Infer Position bias via expectation maximization
- The following description is sourced from Eugene Yan.
- Expectation maximization (EM) is a statistical technique for estimating model parameters when dealing with incomplete or missing data. It can be used to infer position bias in recommender systems.
- In the context of position bias, EM can be used to infer the probability of clicks based on the position of the item in a recommendation list.
- The basic idea is to model the click-through rate (CTR) of each item as a function of its position in the list, and then use EM to estimate the position bias parameter based on the observed click data. The position bias model assumes that an item is clicked only if it is examined and relevant; examination depends only on the position while relevance depends only on the context and item.
- One way to implement this approach is to represent queries and items using features rather than IDs, and use a generalized linear model (GLM) to estimate the CTR as a function of the position and features. Then, EM can be used to iteratively estimate the position bias and re-estimate the GLM parameters until convergence.
- This approach has been demonstrated to be effective in inferring position bias in recommendation systems, particularly in cases where there is only a single click for most queries, as in the case of search logs from email and file storage services.
FairPairs and RandPair
- Another approach is to introduce a bit of randomness into the position of items. FairPairs and RandPair are two examples of this technique.
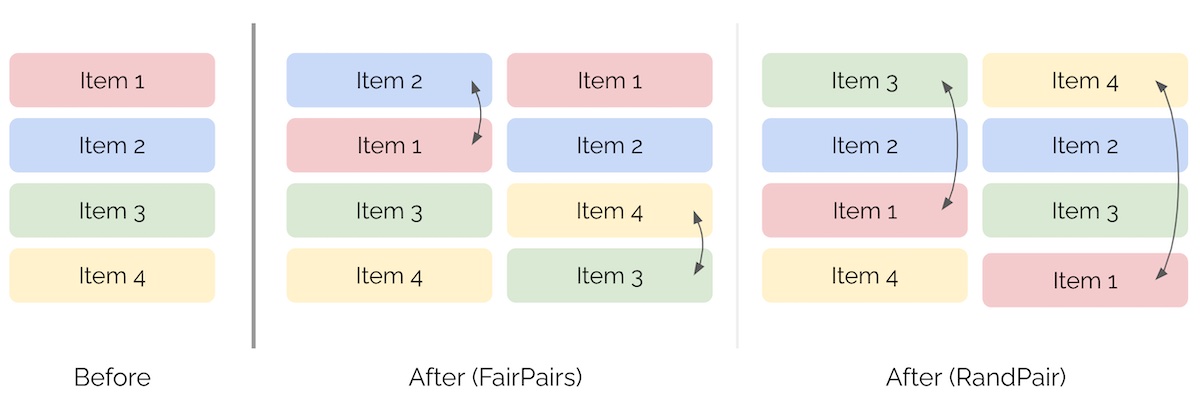
- FairPairs works by swapping the items at positions \(k\) and \(k+1\), where \(k\) is a fixed integer. This simple approach randomizes the relative position of adjacent items and can help to reduce position bias in recommendation results.
- On the other hand, RandPair swaps the first item with an item at position \(k\), where \(k\) is a random integer. Like FairPairs, RandPair introduces some randomness into the position of items, but it does so more aggressively by swapping items that are farther apart. However, this can potentially degrade customer experience, particularly if \(k\) is large.
- Overall, these methods strike a balance between reducing position bias and maintaining good customer experience. By introducing some randomness into item positions, they can help to ensure that recommended items are chosen based on their true relevance rather than simply their position in the list.
- The image below (source) represents the ranking of items after both FairPairs and RandPair.
Mitigation strategies for positional bias
- Add randomness: One way is to add some randomness into the display of items to reduce the impact of position bias. For example, we can randomly shuffle the order of items or swap the positions of some items. This helps to balance the exposure of items in different positions and reduce the influence of position bias. Also, because multiple items can appear in the same position (e.g., position 1), we can log which item performed better and train our models accordingly.
- De-bias logged data: Another way is to use the measured/learned position bias to de-bias the logged data before training the model. This can be done by weighting the training data with inverse propensity scores, which are based on the likelihood of an item being displayed in a certain position. This helps to adjust for the fact that items in different positions have different probabilities of being clicked. For example, Position Bias Estimation for Unbiased Learning to Rank in Personal Search by Google in WSDM ‘18 used inferred position bias to train models optimized on inverse propensity weighted precision.
- Include positional features: Another way is to include positional features in the model to explicitly account for the impact of position on the recommendation. For example, we can add features that encode the position of an item or the distance from the top or bottom of the list. This helps the model learn how position affects the relevance of items and make more accurate recommendations. During serving, we can set all items to have
positional feature = 1 to negate the impact of position. More in Google’s Rules of Machine Learning.
References